HOME > Investor Relations > Financial Indicators
Financial Indicators
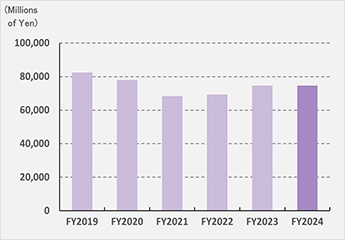
Net sales
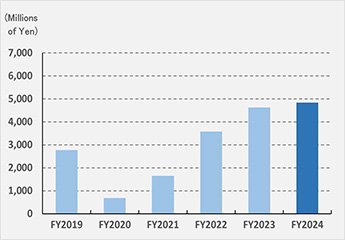
Operating income
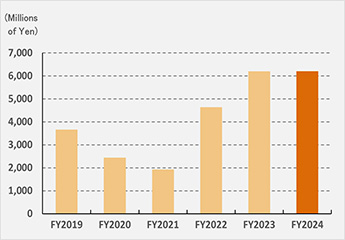
Recurring income
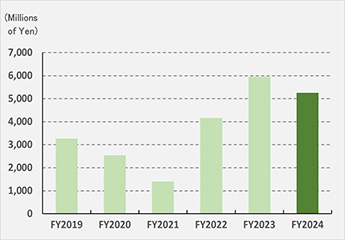
Net income
| Consolidated Operating Results (Millions of yen) |
FY2021 | FY2022 | FY2023 | FY2024 | FY2025 | FY2026 |
|---|---|---|---|---|---|---|
| Net sales | 68,434 | 69,313 | 74,655 | 74,602 | 78,723 | 78,990 |
| Cost of sales | 30,560 | 30,248 | 32,589 | 31,643 | 31,693 | 31,765 |
| Gross profit | 37,873 | 39,065 | 42,065 | 42,959 | 47,029 | 47,225 |
| Selling, general and administrative expenses |
36,478 | 34,900 | 36,110 | 37,702 | 40,846 | 42,113 |
| Operating income | 1,395 | 4,164 | 5,955 | 5,256 | 6,183 | 5,111 |
| Recurring income | 1,925 | 4,644 | 6,201 | 6,202 | 6,364 | 5,872 |
| Net income(loss) | 1,651 | 3,578 | 4,624 | 4,831 | 4,088 | 4,378 |
* Rounded down below millions of yen
| Consolidated Financial Position (at year-end) (Millions of yen) |
FY2021 | FY2022 | FY2023 | FY2024 | FY2025 | FY2026 |
|---|---|---|---|---|---|---|
| Current assets | 44,241 | 45,274 | 47,632 | 49,283 | 41,232 | 43,983 |
| Total assets | 81,764 | 81,829 | 84,773 | 88,628 | 88,911 | 95,201 |
| Current liabilities | 19,366 | 18,084 | 18,979 | 19,966 | 17,990 | 21,716 |
| Total shareholders' equity | 61,069 | 62,971 | 64,296 | 66,893 | 66,505 | 68,792 |
* Rounded down below millions of yen
| Per Share Data (yen) | FY2021 | FY2022 | FY2023 | FY2024 | FY2025 | FY2026 |
|---|---|---|---|---|---|---|
| Net income(loss) | 47.59 | 105.18 | 137.72 | 145.48 | 62.80 | 68.71 |
| Shareholders' equity | 1,759.56 | 1,866.58 | 1,924.95 | 2,036.34 | 1,037.20 | 1,093.58 |
| Cash dividends | 40 | 100 | 120 | 100 | 50* | 50* |
| Number of shares outstanding (in thousands) |
45,000 | 40,000 | 40,000 | 36,000 | 72,000 | 72,000 |
*The Company conducted a stock split at a ratio of 2 shares for every 1 share of common stock on January 1, 2025.
| Key Financial Ratios (%) | FY2021 | FY2022 | FY2023 | FY2024 | FY2025 | FY2026 |
|---|---|---|---|---|---|---|
| Operating income to net sales ratio |
2.0 | 6.0 | 8.0 | 7.0 | 7.9 | 6.5 |
| Return on sales | 2.4 | 5.2 | 6.2 | 6.5 | 5.2 | 5.5 |
| Return on assets | 2.4 | 5.7 | 7.4 | 7.2 | 7.2 | 6.4 |
| Return on equity | 2.8 | 5.8 | 7.3 | 7.4 | 6.1 | 6.5 |
| Equity ratio | 74.7 | 77.0 | 75.8 | 75.5 | 74.8 | 72.3 |